Documentation Index
Fetch the complete documentation index at: https://support.servicem8.com/llms.txt
Use this file to discover all available pages before exploring further.
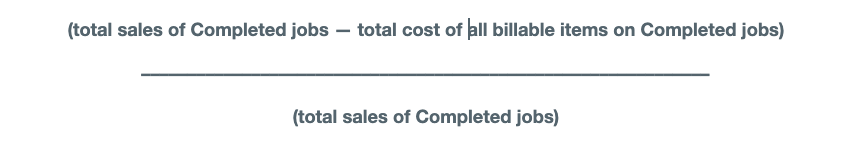
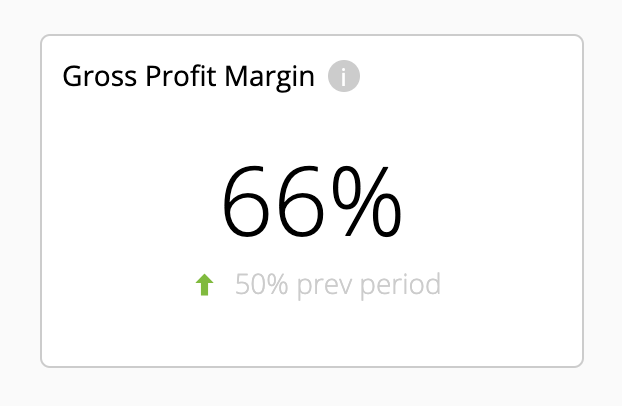 Your Gross Profit Margin in the Business Dashboard is the percentage of the total sales value of Completed jobs in the last 28 days which was profit:
 Immediately below is the percentage change in your Gross Profit Margin from the previous to the current reporting period (change in percentage, not percentage points), and an arrow indicator as to whether the current reporting period’s Gross Profit Margin is higher or lower than the previous reporting period.
Your Gross Profit Margin is an indicator of how profitable your services are in general.
If you want to increase your Gross Profit Margin, there are various ServiceM8 features and reports which can help inform your decision-making:
Immediately below is the percentage change in your Gross Profit Margin from the previous to the current reporting period (change in percentage, not percentage points), and an arrow indicator as to whether the current reporting period’s Gross Profit Margin is higher or lower than the previous reporting period.
Your Gross Profit Margin is an indicator of how profitable your services are in general.
If you want to increase your Gross Profit Margin, there are various ServiceM8 features and reports which can help inform your decision-making:
Job Costing Add-on
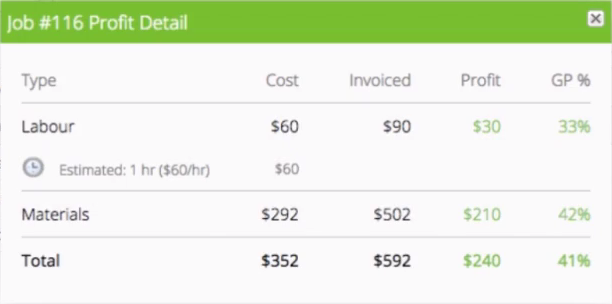
With the Job Costing add-on, you can quickly get a picture of how profitable a job will be while you’re quoting, and then see how much you made after the job has been completed.
Each job’s estimated profit is clearly displayed in the job card of the Online Dashboard. Hovering over the profit gives you a breakdown of materials and labour, and clicking on the profit icon provides a more in-depth breakdown of costs and gross profit. The Job Costing add-on even tracks administration time automatically, which is often a hidden cost to your business.
 This all helps to:
• Prevent under-quoting for jobs
• Check that you’ve remembered to charge for all labour recorded against a job
• Understand which types of jobs are good for your business, and which ones are not
Job Costing is a ServiceM8 Add-on — activate it in Settings > ServiceM8 Add-ons. If you can’t see the add-on, check your plan details.
Learn more about the Job Costing Add-on.
This all helps to:
• Prevent under-quoting for jobs
• Check that you’ve remembered to charge for all labour recorded against a job
• Understand which types of jobs are good for your business, and which ones are not
Job Costing is a ServiceM8 Add-on — activate it in Settings > ServiceM8 Add-ons. If you can’t see the add-on, check your plan details.
Learn more about the Job Costing Add-on.
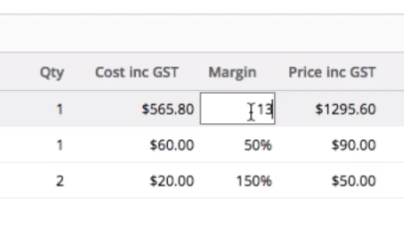
Margin Billing Add-on
The Margin Billing Add-on adds Cost Price and percentage Margin columns to the Quotes & Invoicing tab of job cards in the Online Dashboard. This enables you to view and set sale costs per item on a percentage markup basis, assisting with quoting and ensuring job profitability.
 Margin Billing is a ServiceM8 Add-on — activate it in Settings > ServiceM8 Add-ons. If you can’t see the add-on, check your plan details.
Learn more about the Margin Billing Add-on.
Margin Billing is a ServiceM8 Add-on — activate it in Settings > ServiceM8 Add-ons. If you can’t see the add-on, check your plan details.
Learn more about the Margin Billing Add-on.
Reports
Materials Usage Report
The Materials Usage Report shows the most-used Materials & Services across your jobs over a specified date range, and can be additionally segmented by individual staff members and Job Categories. This report offers insight into the quantity of specific billable items being charged across all jobs, and the role these most-used Materials & Service play in your overall revenue. Look at ways to increase the profitability of these most-used billable Materials & Services. Learn more.
Custom Reports (Jobs Profit & Jobs Cost)
An on-demand, customisable reporting tool available upon activating the Advanced Reporting Pack Add-on, Custom Reports enable you to report on Jobs Profit and Jobs Cost, segmented by Job Category, Job Status and/or Staff Member, over a timeframe of:
-
Last month
-
This month
-
This year
-
Last 3 months
-
Last 12 months
-
Year on Year
Learn more about Custom Reports.
Note — Custom Reports on Job Profit & Cost require activation of the Job Costing Add-on.
Revenue By Category Report
An on-demand report in the Reports tab of your Online Dashboard, the Revenue By Category Report bar graphs your revenue by month from Completed jobs which have been ‘Approved’ in your invoicing workflow.
Ensure you’ve created considered Job Categories, they’re set in your Job Templates, and your team is diligent in assigning new jobs to the appropriate Job Category.
Breaking down your revenue by Job Category may offer more insight into what part different services play in your overall revenue, and viewed in conjunction with Custom Reports on Jobs Profit and Jobs Cost, help identify Job Categories where a focus on improving profitability with certain job types or staff members could yield results.
Learn more.