Creating a Custom Report
1. To create a custom report, ensure you’ve activated the Advanced Reporting Pack add-on, then go to Reports, and in the left-hand menu, click ‘Create Report’.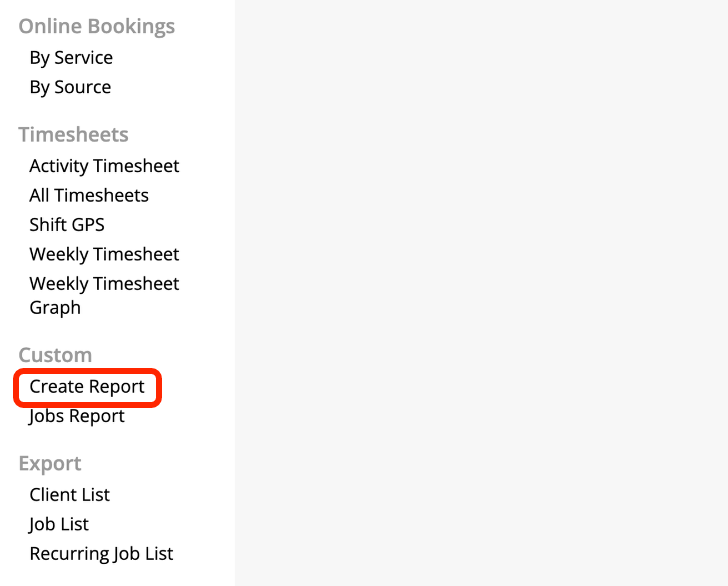

How to create a custom report, manually
- Select Your Metric: Click the + button in the “Metrics” section. The first metric is automatically set to “Jobs,” but you can change this to other options like “Job Bookings,” “Job Checklists,” or “Job Payments.”
- Adjust the Time Frame and Grouping: Use the time frame selectors to view data for a specific period (e.g., last 30 days, 3 months, 12 months). You can also compare it to a previous period.
- Add Filters: In the “Filters” section, click the + button to add criteria to narrow down your report. For example, you can filter by “Job Status” and select “Completed.”
- Break Down the Data: In the “Breakdown” section, click + and select a field to break down the data. This will segment your report, for example, by “Staff Member,” “Category,” or “Job Badge.”
- Use Multiple Metrics: You can add more than one metric to your report to see comparisons. For instance, you can add “Total Invoice Amount” and “Total Cost” to see both figures side-by-side. To do this, duplicate an existing metric and then change the field.
- Choose a Report Visualization: You can switch between a line graph, bar graph, or table to visualize your data in the most effective way.
- Save Your Report: If you create a report you’d like to use again, click the “Save” button in the top-right corner, give it a title and description, and it will be saved for quick access.
Using the AI Smart Reporting Helper
For a faster way to generate reports, you can use the AI-powered, Smart Reporting Helper.- Select “Create Report”: In the left-hand menu, under “Reports,” select “Create Report.”
- Describe the Report: In the text box, describe the report you want in plain language. For example, “Total invoiced by staff member.”
- Produce the Report: Click “Produce Report.” The AI will automatically fill out the metrics, filters, and breakdowns based on your prompt.
- Refine the Report: You can then manually add or change filters or breakdowns, or simply update your original prompt to refine the report (e.g., “for only the workshop category”).
- Total invoiced amount broken down by staff member.
- Total jobs created per week in the last 6 months.
- Show me my average job cost per category.
- Job revenue broken down by marketing source job badges.
- Show me checked-in travel time and travel distance by staff member.
Advanced Reporting Capabilities
The core of the reporting engine is the interaction between three elements: metrics, filters, and breakdowns.- The metric is what you are measuring (e.g., number of jobs, total invoice amount).
- Filters narrow down your data set (e.g., only show completed jobs or jobs in a specific category).
- A breakdown segments your data into groups based on a field, allowing you to see a direct comparison (e.g., how many jobs each staff member completed).How the ‘Aggregate by Field’ Feature Works
- Start by adding a “Jobs” metric and breaking it down by “Completion Actioned By Staff Member.”
- Next, click the three-dot menu on the “Jobs” metric. Select “Aggregate by field” and choose “Total Invoice Amount.” This will now show you the sum of all invoices completed by each staff member.
- To add a second metric for comparison, duplicate the first metric. Then, change the “Aggregate by field” option on the new metric to “Total Cost.”